SDG Impact Investment Toolkit
The methodology
The SDG Investment Impact Toolkit
In order to support the investment decision of investors interested in IDB projects, SDSN has developed an SDG Investment Impact Toolkit to provide information on the potential impact of projects in the infrastructure, social, financial and private sectors. The toolkit builds on SDSN’s audited and peer-reviewed methodology for assessing countries’ performance, gaps, and trends vis à vis the SDGs and enriches this information in order to assess the impact potential of projects according to the national context and each specific investment sector.
The first pilot version was presented in 2019. The current version incorporates a more comprehensive framework, more sectors, and more project categories and allows for further customization to generate results at portfolio level and through the new Impact Explorer tool. The sectors and subsectors were selected in collaboration with the IDB building on internal taxonomies of project categories.
This SDG Investment Impact Toolkit should be viewed as an entry-point to help prioritize investments in LAC countries. It does not replace detailed country reviews and assessments. The tool evaluates SDG impact potential ex ante (before it is implemented). It should be complemented by rigorous and systematic assessments ex post of the impact of infrastructure projects and other project categories in addressing SDG gaps.
The toolkit features an impact explorer that lists the countries, sectors, and subsectors where an investment may have the greatest impact potential. This list can be filtered by country, by sector and subsector, and by SDG. Additionally, a portfolio planner tool helps to assess the impact potential of a portfolio of investments, both at the level of the individual investment as well as for the portfolio as a whole.
The overall impact potential for every project is calculated on the basis of the potential impact of sectoral investment to close remaining SDG gaps. The methodology used builds on the peer-reviewed and statistically audited SDG Index methodology developed by the UN Sustainable Development Solutions Network (Papadimitriou et al., 2019; Schmidt-Traub et al., 2017). It incorporates data both on countries’ current performance as well as on countries’ performance over time (trends).
At the overall SDG Index level, the Toolkit emphasizes the high SDG impact potential of further investments in strengthening access to and quality of tertiary education, renewable energy infrastructure, green lending and access to financing for micro/small and medium enterprises. Especially in countries with low SDG performance such as Belize, Honduras, Guatemala, Trinidad and Tobago but also in countries with higher SDG performance but facing major performance gaps in certain areas including Brazil, Colombia and Mexico. Priority sectors and countries vary extensively across each seventeen SDGs.
Calculation
The total impact potential for a given country and investment sector is based on two components:
- The SDG achievement gaps in the country.
- The positive and negative impacts of the investment sector on the SDGs.
Together, they provide a total impact potential that measures the potential for additional investments for a given country and sector to advance progress on the SDGs where it most urgently needed. The highest impact potential is assigned to investments in countries with large performance gaps and to sectors that can help to close those gaps.
| Color band | Impact Potential |
|---|---|
| LEVEL IV | |
| LEVEL III | |
| LEVEL II | |
| LEVEL I | |
| N/A |
SDG Achievement Gaps
The methodology for calculating SDG achievement gaps for each country follows the peer-reviewed and audited SDG Index methodology. Each of the 100+ indicators are assigned a target value (upper bound) as well as a lower bound, which are used to normalize the raw indicator values into scores from 0 to 100 (target achieved).
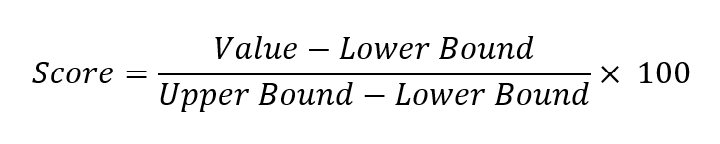
The SDG achievement gap for each indicator is then the difference between the current score and the target score of 100.
In addition to the static assessment of SDG achievement gaps based on countries’ latest available data on each indicator, the methodology also takes into account the projected achievement gap in 2030. For this, the linear growth rate over the past 3 – 5 years was calculated and a country’s performance in 2030 was then projected on the basis of this linear growth rate.
The final SDG achievement gap is the average of the static SDG achievement gap and the projected SDG achievement gap in 2030, where the static SDG achievement gap is given twice the weight of the projected SDG achievement gap.
Sector Impact
The positive or negative impact of each investment sector on each of the 100+ indicators was assessed on a scale of -3 (strong direct negative impact) to +3 (strong direct positive impact). The scores reflect the general impact that an investment in a sector is likely to have on each of the indicators. For example, an investment in primary education is likely to have a strong direct positive impact on the primary school completion rate. Conversely, an investment in airport infrastructure is likely to have negative impacts on the country’s carbon footprint. The assessments are based on expert judgement and were made in exchange and collaboration with the IDB.
| Impact | Numeric representation |
|---|---|
| Strong direct negative impact | -3 |
| Weak direct or strong indirect negative impact | -2 |
| Weak indirect negative impact | -1 |
| Neutral impact or no impact | 0 |
| Weak indirect positive impact | +1 |
| Weak direct or strong indirect positive impact | +2 |
| Strong direct positive impact | +3 |
Impact Potential
To calculate the total impact potential, data is first aggregated at the indicator level and then at the SDG level. For each combination of country and sector, indicator impact potentials are calculated based on the product of the SDG achievement gap for the indicator in that country and the investment impact for the indicator. The scores range from -300 (very negative potential) to +300 (very positive potential).

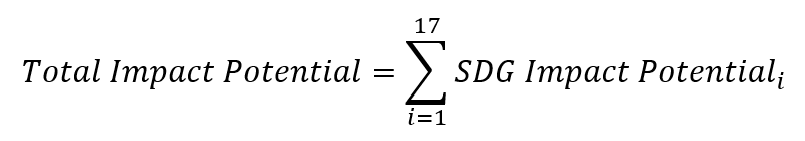
The indicator impact potentials are then aggregated at the goal level by calculating the average. This ensures that all goals are scored equally on the same range of -300 to +300, regardless of the number of associated indicators.
The total impact potential is then calculated as the sum of the 17 SDG impact potentials, so that all positive and negative impacts of a sector across all the goals are taken into account.
Limitations and future work
This SDG Impact Investment Toolkit should be viewed as an entry-point to help identify the sectors and countries to prioritize in the region for high SDG impact investments. It incorporates tens of thousands of data points. As such it is a rather complex tools which tries to capture the latest SDG performance and gaps of each country, potential impact of sector investments on each SDG as well as sector quality, investment data over time, and the enabling public and private sector environment. It aims to support resource mobilization targeted towards the SDGs.
- First, this toolkit does not replace a detailed country strategy and detailed assessment of the expected and observed impact of specific projects. As any highly aggregated tool, it is a simplification of reality. By nature, it cannot integrate contextual and granular information about the nature of each projects and area where it is implemented.
- Second, this toolkit provides ex ante information but does not assess ex post the observed impact of infrastructure and social projects implemented.
- Third, all the information is provided at the country level, which does not allow to integrate the territorial and local dimension of SDG investments. As emphasized in many SDSN reports, for instance in Bolivia and Brazil (see charts below), there are wide variations in SDG performance within countries. The toolkit provides average results at the country level which may not reflect adequately differences across regions and cities within countries. In future iterations, it would be possible to integrate the territorial dimension and distinguish SDG impact potential at subnational level (cities/regions).
- Fourth, assigning a qualitative score to the potential impact of each sector and subsector on each indicator is based on the authors’ judgement and may seem arbitrary. Some sectors and subsectors are more difficult to score than others. For instance, easier access to financing for SMEs can be both positive or negative for the SDGs, depending on whether this additional financing supports primarily sustainable companies and projects or other types of companies and projects. The sectors and subsectors and their definitions have been identified together with the IDB.
In order to support the investment decision of investors interested in IDB projects, SDSN has developed an SDG Investment Impact Toolkit to provide information on the potential impact of projects in the infrastructure, social, financial and private sectors. To this end, SDG scores obtained from the analysis of the Sustainable Development Report (Sachs, Schmidt-Traub, et al., 2020) and the SDG Index for Latin America and the Caribbean (Cods, 2020) were combined with current and trend data on sector quality, investment levels, and the investment environment to assess which projects can have a higher impact depending on the national context.
Feedback? Questions? Contact us at info@sdgindex.org